

Insights

Ballots and Balance Sheets: What Do Midterm Elections Actually Mean for Your Portfolio?

Ballots and Balance Sheets: What Do Midterm Elections Actually Mean for Your Portfolio?

Topic(s):

Every two years, the entire U.S. House of Representatives and one-third of the Senate are up for reelection. And right on schedule, the financial media machine kicks into overdrive.

As Election Day approaches, investors are bombarded with breathless predictions: If Party A takes the House, these sectors will crash. If Party B holds the Senate, expect a rally. When you care deeply about the direction of the country, it is remarkably difficult to separate your political anxieties from your financial decisions. Watching the news makes it feel irresponsible to “just sit there” and do nothing with your portfolio.

So, a natural question arises: Should we adjust our investments before the midterm results come in?

When you look at nearly a century of market history rather than cable news banners, the answer is clear. Making short-term portfolio changes based on changes in the political winds is one of the easiest ways to derail a long-term financial plan.

The Double Guessing Game

Trying to trade around an election requires you to get two notoriously difficult predictions right at the exact same time:

  1. You have to accurately predict the outcome of the election.
  2. You have to accurately predict how the market will react to that outcome.

Getting the first part right is hard enough. Getting the second part right is nearly impossible.

Consider the 2016 presidential election. Leading up to November, the overwhelming consensus among financial pundits—from CNN Money to The New York Times—was that a surprise victory by Donald Trump would cause immediate market turmoil and sink stocks. Yet, the day after the election, the S&P 500 Index closed 1.1% higher.

Even if you had a crystal ball that told you the exact vote count in advance, acting on the prevailing “expert” narrative would have led you to sell right before a rally.

Why does this happen? Because the stock market is a relentless, forward-looking information-processing machine. Every day, millions of participants place billions of dollars in trades, meaning current prices already reflect the combined expectations, fears, and probabilities of all investors. By the time you read a headline about how an election might impact stocks, the market has already priced it in.

A Century of Midterms: What the Data Actually Shows

What about congressional midterms specifically? Does a shift in the balance of power on Capitol Hill trigger abnormal market behavior?

Researchers at Dimensional Fund Advisors examined 100 years of S&P 500 Index data (from January 1926 through December 2025) to see how stocks behaved during midterm election months compared to normal, non-election months.
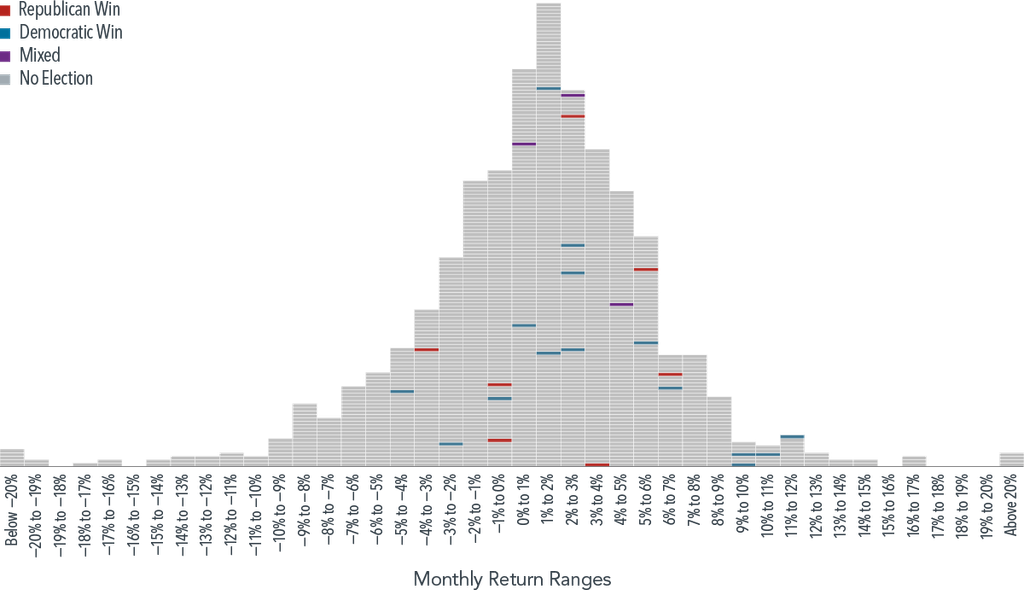
Midterm Elections and S&P 500 Index Returns, Histogram of Monthly Returns (January 1926–December 2025). Source: Dimensional Fund Advisors.

To read this chart, think of each small horizontal rectangle as a single month over the last century, stacked into columns based on how the S&P 500 performed that month (from below -20% on the far left to above +20% on the far right). The gray boxes are normal, non-election months, while the colored dashes highlight midterm election months: red for a Republican sweep, blue for a Democratic sweep, and purple for mixed control.

The visual takeaway is striking:

  • Midterm months look like any other month: The colored dashes aren’t clustered on the far left in a “crash zone” or on the far right in a “euphoria zone”. They are scattered right in the middle of the bell curve, mostly landing in the typical 0% to 3% monthly return range alongside normal non-election months.
  • Party control doesn’t dictate short-term direction: Whether Republicans won both chambers (red), Democrats won both chambers (blue), or voters delivered a split Congress (purple), the distribution of market returns appears completely random.

Companies Adapt Faster Than Politicians

While it is easy to get distracted by month-to-month noise, what actually matters for your retirement is how your wealth compounds over decades.
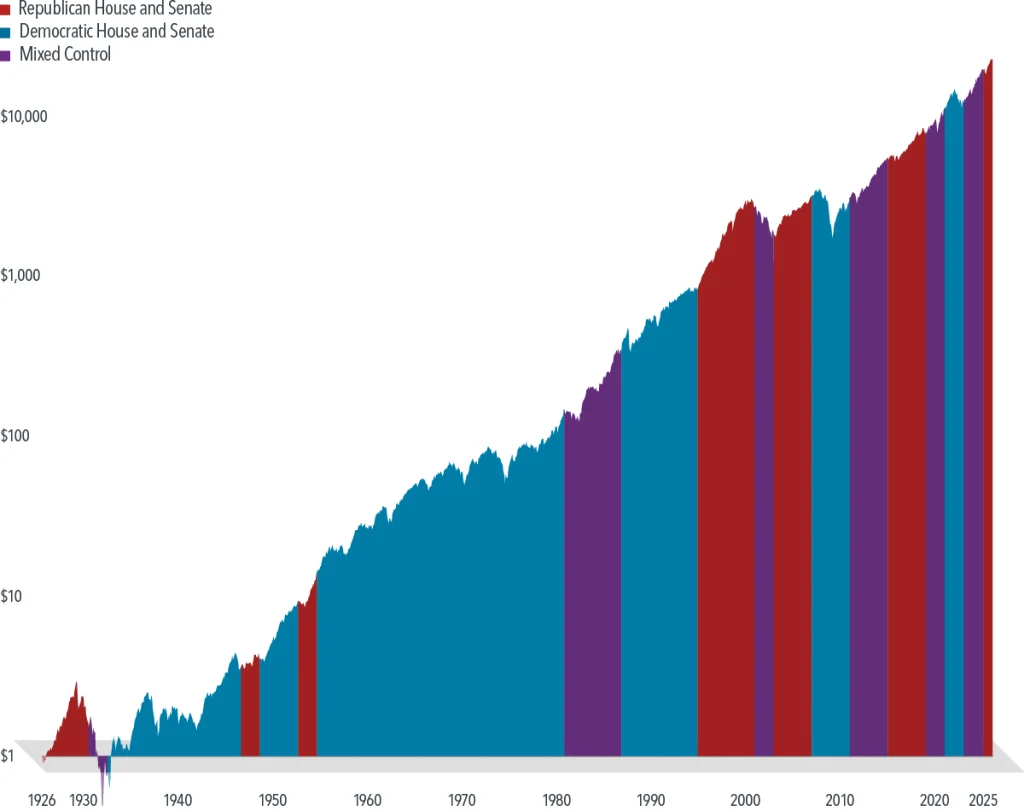
Hypothetical Growth of $1 Invested in the S&P 500 Index and Party Control of Congress (January 1926–December 2025). Source: Dimensional Fund Advisors.

As the second chart illustrates, the hypothetical growth of $1 invested in the S&P 500 back in 1926 through the end of 2025 follows a relentless upward trajectory across 100 years of American history. Along that timeline, control of Congress flipped back and forth between Republican control (red), Democratic control (blue), and divided government (purple) dozens of times. Both parties presided over booming bull markets, and both parties were in power during painful recessions.

There is no discernible pattern showing that one party—or a divided Congress—is reliably “better” for your portfolio.

The reason is simple: Shareholders are not investing in the House or the Senate. They are investing in businesses.

Publicly traded companies are run by management teams whose full-time job is to navigate changing environments. Whether Washington passes new tax laws, alters regulatory frameworks, or changes trade policies, corporations adapt. They restructure supply chains, innovate, manage expenses, and find ways to generate profits regardless of who holds the gavel—and sometimes, if you are tired of political ads, you might say they do it in spite of who is in power.

Keep Your Politics at the Ballot Box

Elections have real consequences for policy, legislation, and the country. Your vote matters.

However, expressing your political views through your retirement portfolio is rarely a winning strategy. At best, trying to time the market around midterms relies on pure luck. At worst, it leads to costly emotional mistakes—like moving to cash out of fear and missing out on long-term compounding while waiting for the political dust to settle.

Patience and a well-structured financial plan will always do more for your net worth than trying to outguess the electorate. Vote your conscience on Tuesday, and let your portfolio keep working for the long haul.

Every two years, the entire U.S. House of Representatives and one-third of the Senate are up for reelection. And right on schedule, the financial media machine kicks into overdrive.

As Election Day approaches, investors are bombarded with breathless predictions: If Party A takes the House, these sectors will crash. If Party B holds the Senate, expect a rally. When you care deeply about the direction of the country, it is remarkably difficult to separate your political anxieties from your financial decisions. Watching the news makes it feel irresponsible to “just sit there” and do nothing with your portfolio.

So, a natural question arises: Should we adjust our investments before the midterm results come in?

When you look at nearly a century of market history rather than cable news banners, the answer is clear. Making short-term portfolio changes based on changes in the political winds is one of the easiest ways to derail a long-term financial plan.

The Double Guessing Game

Trying to trade around an election requires you to get two notoriously difficult predictions right at the exact same time:

  1. You have to accurately predict the outcome of the election.
  2. You have to accurately predict how the market will react to that outcome.

Getting the first part right is hard enough. Getting the second part right is nearly impossible.

Consider the 2016 presidential election. Leading up to November, the overwhelming consensus among financial pundits—from CNN Money to The New York Times—was that a surprise victory by Donald Trump would cause immediate market turmoil and sink stocks. Yet, the day after the election, the S&P 500 Index closed 1.1% higher.

Even if you had a crystal ball that told you the exact vote count in advance, acting on the prevailing “expert” narrative would have led you to sell right before a rally.

Why does this happen? Because the stock market is a relentless, forward-looking information-processing machine. Every day, millions of participants place billions of dollars in trades, meaning current prices already reflect the combined expectations, fears, and probabilities of all investors. By the time you read a headline about how an election might impact stocks, the market has already priced it in.

A Century of Midterms: What the Data Actually Shows

What about congressional midterms specifically? Does a shift in the balance of power on Capitol Hill trigger abnormal market behavior?

Researchers at Dimensional Fund Advisors examined 100 years of S&P 500 Index data (from January 1926 through December 2025) to see how stocks behaved during midterm election months compared to normal, non-election months.

Midterm Elections and S&P 500 Index Returns, Histogram of Monthly Returns (January 1926–December 2025). Source: Dimensional Fund Advisors.

To read this chart, think of each small horizontal rectangle as a single month over the last century, stacked into columns based on how the S&P 500 performed that month (from below -20% on the far left to above +20% on the far right). The gray boxes are normal, non-election months, while the colored dashes highlight midterm election months: red for a Republican sweep, blue for a Democratic sweep, and purple for mixed control.

The visual takeaway is striking:

  • Midterm months look like any other month: The colored dashes aren’t clustered on the far left in a “crash zone” or on the far right in a “euphoria zone”. They are scattered right in the middle of the bell curve, mostly landing in the typical 0% to 3% monthly return range alongside normal non-election months.
  • Party control doesn’t dictate short-term direction: Whether Republicans won both chambers (red), Democrats won both chambers (blue), or voters delivered a split Congress (purple), the distribution of market returns appears completely random.

Companies Adapt Faster Than Politicians

While it is easy to get distracted by month-to-month noise, what actually matters for your retirement is how your wealth compounds over decades.

Hypothetical Growth of $1 Invested in the S&P 500 Index and Party Control of Congress (January 1926–December 2025). Source: Dimensional Fund Advisors.

As the second chart illustrates, the hypothetical growth of $1 invested in the S&P 500 back in 1926 through the end of 2025 follows a relentless upward trajectory across 100 years of American history. Along that timeline, control of Congress flipped back and forth between Republican control (red), Democratic control (blue), and divided government (purple) dozens of times. Both parties presided over booming bull markets, and both parties were in power during painful recessions.

There is no discernible pattern showing that one party—or a divided Congress—is reliably “better” for your portfolio.

The reason is simple: Shareholders are not investing in the House or the Senate. They are investing in businesses.

Publicly traded companies are run by management teams whose full-time job is to navigate changing environments. Whether Washington passes new tax laws, alters regulatory frameworks, or changes trade policies, corporations adapt. They restructure supply chains, innovate, manage expenses, and find ways to generate profits regardless of who holds the gavel—and sometimes, if you are tired of political ads, you might say they do it in spite of who is in power.

Keep Your Politics at the Ballot Box

Elections have real consequences for policy, legislation, and the country. Your vote matters.

However, expressing your political views through your retirement portfolio is rarely a winning strategy. At best, trying to time the market around midterms relies on pure luck. At worst, it leads to costly emotional mistakes—like moving to cash out of fear and missing out on long-term compounding while waiting for the political dust to settle.

Patience and a well-structured financial plan will always do more for your net worth than trying to outguess the electorate. Vote your conscience on Tuesday, and let your portfolio keep working for the long haul.