
Pursuing a Better Investment Experience
Our Investment Philosophy
Key Principles to Improve Your Odds of Success
1. Embrace Market Pricing
The market is an effective information-processing machine. Each day, the world equity markets process billions of dollars in trades between buyers and sellers—and the real-time information they bring helps set prices.

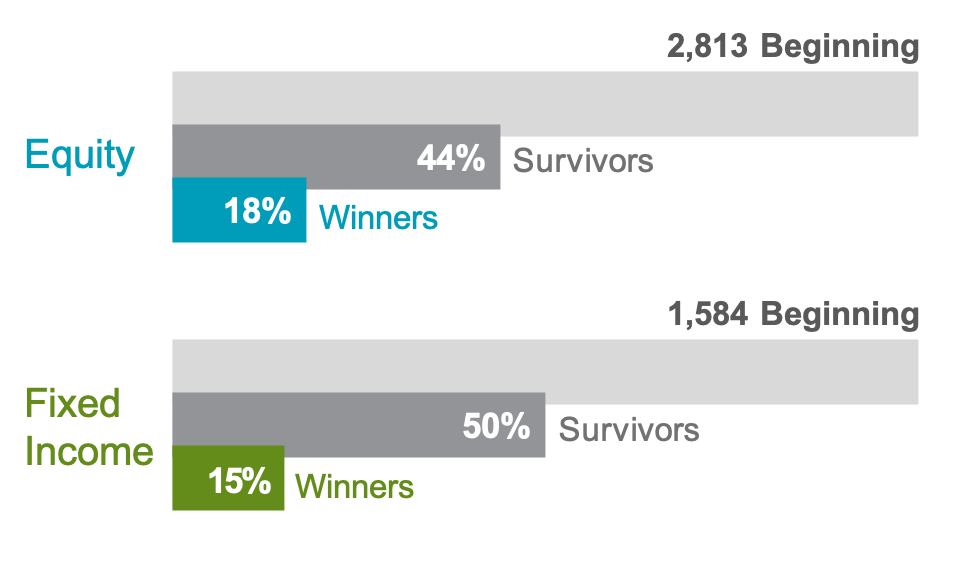
2. Don’t Try to Outguess the Market
The market’s pricing power works against fund managers who try to outperform through stock picking or market timing. As evidence, only 18% of US-domiciled equity funds and 15% of fixed income funds have survived and outperformed their benchmarks over the past 20 years.
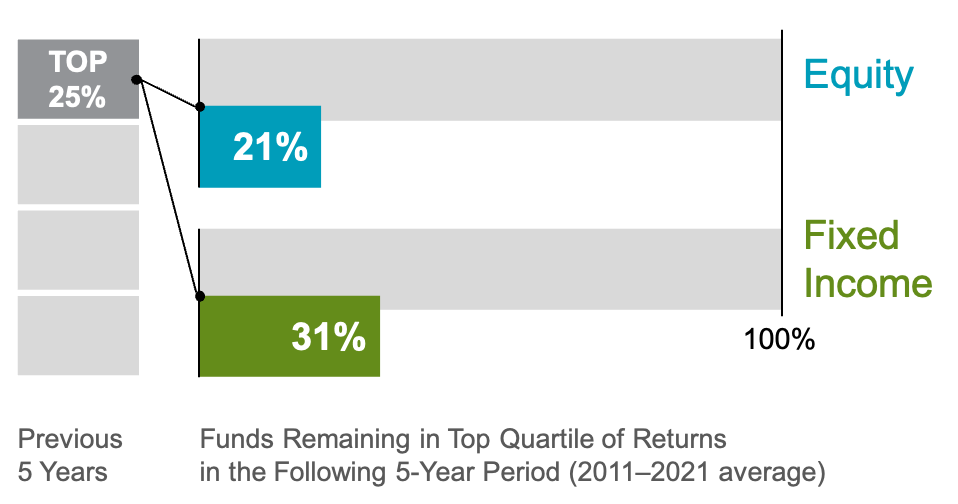
3. Resist Chasing Past Performance
Some investors select funds based on their past returns. Yet, past performance offers little insight into a fund’s future returns. For example, most funds in the top quartile of previous five-year returns did not maintain a top-quartile ranking in the following five years.
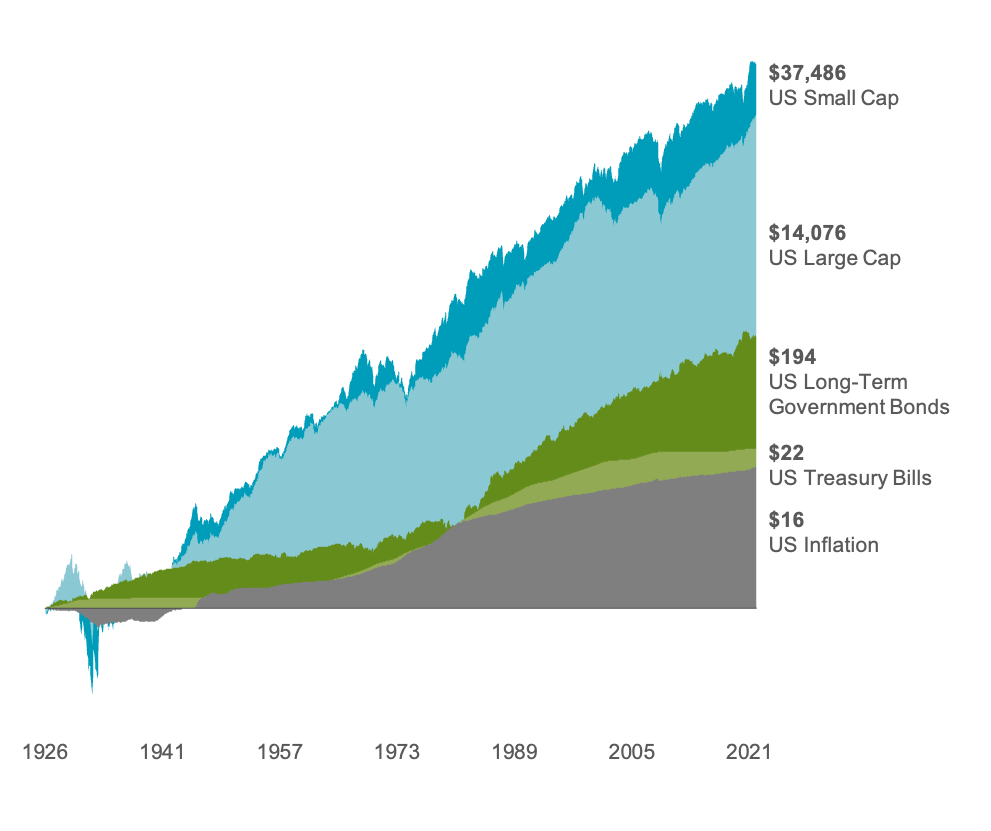
4. Let Markets Work for You
The financial markets have rewarded long-term investors. People expect a positive return on the capital they supply, and historically, the equity and bond markets have provided growth of wealth that has more than offset inflation.

5. Consider the Drivers of Returns
There is a wealth of academic research into what drives returns. Expected returns depend on current market prices and expected future cash flows. Investors can use this information to pursue higher expected returns in their portfolios.
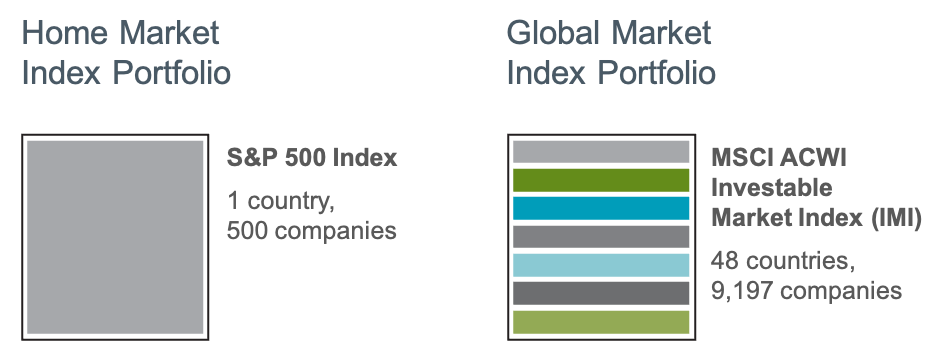
6. Practice Smart Diversification
Holding securities across many market segments can help manage overall risk. But diversifying within your home market may not be enough. Global diversification can broaden your investment universe.
7. Avoid Market Timing
You never know which market segments will outperform from year to year. By holding a globally diversified portfolio, investors are well positioned to seek returns wherever they occur.

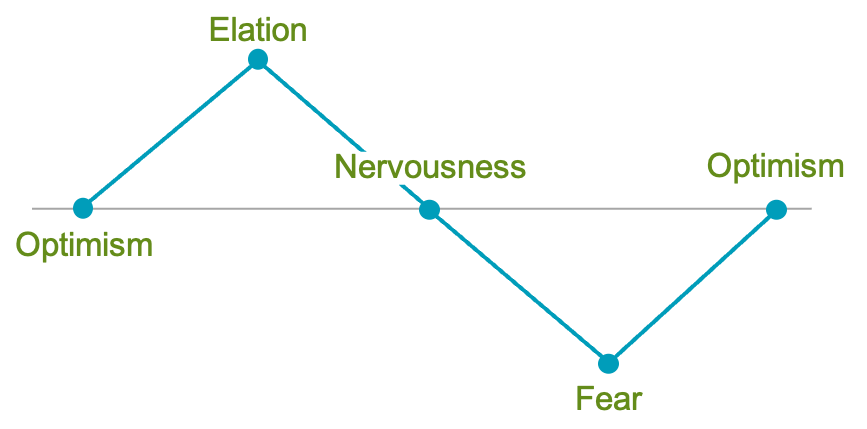
8. Manage Your Emotions
Many people struggle to separate their emotions from investing. Markets go up and down. Reacting to current market conditions may lead to making poor investment decisions.
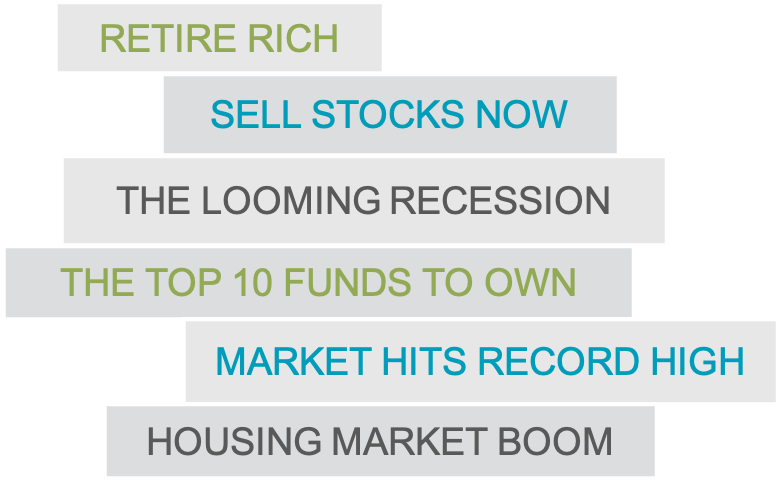
9. Look Beyond the Headlines
Daily market news and commentary can challenge your investment discipline. Some messages stir anxiety about the future, while others tempt you to chase the latest investment fad. When headlines unsettle you, consider the source and maintain a long-term perspective.
10. Focus on What You Can Control
A financial advisor can offer expertise and guidance to help you focus on actions that add value. This can lead to a better investment experience.
- Create an investment plan to fit your needs and risk tolerance.
- Structure a portfolio along the dimensions of expected returns.
- Diversify globally.
- Manage expenses, turnover, and taxes.
- Stay disciplined through market dips and swings.
DISCLOSURES
Exhibit 1: In USD. Source: Dimensional, using data from Bloomberg LP. Includes primary and secondary exchange trading volume globally for equities. ETFs and funds are excluded. Daily averages were computed by calculating the trading volume of each stock daily as the closing price multiplied by shares traded that day. All such trading volume is summed up and divided by 252 as an approximate number of annual trading days.
Exhibit 2: The sample includes funds at the beginning of the 20-year period ending December 31, 2021. Each fund is evaluated relative to its primary prospectus benchmark. Survivors are funds that had returns for every month in the sample period. Winners are funds that survived and outperformed their benchmark over the period. Where the full series of primary prospectus benchmark returns is unavailable, non-Dimensional funds are instead evaluated relative to their Morningstar category index.
Exhibit 3: This study evaluated fund performance over rolling periods from 2002 through 2021. Each year, funds are sorted within their category based on their previous five-year total return. Those ranked in the top quartile of returns are evaluated over the following five-year period. The chart shows the average percentage of top-ranked equity and fixed income funds that kept their top ranking in the subsequent period.
Source (Exhibits 2 and 3): The sample includes US-domiciled, USD-denominated open-end and exchange-traded funds (ETFs) in the following Morningstar categories. Non-Dimensional fund data provided by Morningstar. Dimensional fund data is provided by the fund accountant. Dimensional funds or subadvised funds whose access is or previously was limited to certain investors are excluded. Index funds, load-waived funds, and funds of funds are excluded from the industry sample. Morningstar Categories (Equity): Equity fund sample includes the following Morningstar historical categories: Diversified Emerging Markets, Europe Stock, Foreign Large Blend, Foreign Large Growth, Foreign Large Value, Foreign Small/Mid Blend, Foreign Small/Mid Growth, Foreign Small/Mid Value, Global Real Estate, Japan Stock, Large Blend, Large Growth, Large Value, Mid-Cap Blend, Mid-Cap Growth, Mid-Cap Value, Miscellaneous Region, Pacific/Asia ex-Japan Stock, Real Estate, Small Blend, Small Growth, Small Value, World Large-Stock Blend, World Large-Stock Growth, World Large-Stock Value, and World Small/Mid Stock. Morningstar Categories (Fixed Income): Fixed income fund sample includes the following Morningstar historical categories: Corporate Bond, High Yield Bond, Inflation-Protected Bond, Intermediate Core Bond, Intermediate Core-Plus Bond, Intermediate Government, Long Government, Muni California Intermediate, Muni California Long, Muni Massachusetts, Muni Minnesota, Muni National Intermediate, Muni National Long, Muni National Short, Muni New Jersey, Muni New York Intermediate, Muni New York Long, Muni Ohio, Muni Pennsylvania, Muni Single State Intermediate, Muni Single State Long, Muni Single State Short, Muni Target Maturity, Short Government, Short-Term Bond, Ultrashort Bond, World Bond, and World Bond-USD Hedged. Index Data Sources: Index data provided by Bloomberg, MSCI, Russell, FTSE Fixed Income LLC, and S&P Dow Jones Indices LLC. Bloomberg data provided by Bloomberg. MSCI data © MSCI 2022, all rights reserved. Frank Russell Company is the source and owner of the trademarks, service marks, and copyrights related to the Russell Indexes. FTSE fixed income indices © 2022 FTSE Fixed Income LLC. All rights reserved. S&P data © 2022 S&P Dow Jones Indices LLC, a division of S&P Global. All rights reserved. Indices are not available for direct investment. Their performance does not reflect the expenses associated with management of an actual portfolio. US-domiciled mutual funds and US-domiciled ETFs are not generally available for distribution outside the US.
Exhibit 4: In USD. US Small Cap is the CRSP 6–10 Index. US Large Cap is the S&P 500 Index. US Long-Term Government Bonds is the IA SBBI US LT Govt TR USD. US Treasury Bills is the IA SBBI US 30 Day TBill TR USD. US Inflation is measured as changes in the US Consumer Price Index. CRSP data is provided by the Center for Research in Security Prices, University of Chicago. S&P data © 2022 S&P Dow Jones Indices LLC, a division of S&P Global. All rights reserved. US long-term government bonds and Treasury bills data provided by Ibbotson Associates via Morningstar Direct. US Consumer Price Index data is provided by the US Department of Labor Bureau of Labor Statistics.
Exhibit 5: Relative price is measured by the price-to-book ratio; value stocks are those with lower price-to-book ratios. Profitability is measured as operating income before depreciation and amortization minus interest expense scaled by book.
Exhibit 6: Number of holdings and countries for the S&P 500 Index and MSCI ACWI (All Country World Index) Investable Market Index (IMI) as of December 31, 2021. S&P data © 2022 S&P Dow Jones Indices LLC, a division of S&P Global. All rights reserved. MSCI data © MSCI 2022, all rights reserved. International investing involves special risks, such as currency fluctuation and political instability. Investing in emerging markets may accentuate these risks.
Exhibit 7: In USD. US Large Cap is the S&P 500 Index. US Large Cap Value is the Russell 1000 Value Index. US Small Cap is the Russell 2000 Index. US Small Cap Value is the Russell 2000 Value Index. US Real Estate is the Dow Jones US Select REIT Index. International Large Cap Value is the MSCI World ex USA Value Index (gross dividends). International Small Cap Value is the MSCI World ex USA Small Cap Value Index (gross dividends). Emerging Markets is the MSCI Emerging Markets Index (gross dividends). Five-Year US Government Fixed is the Bloomberg US Treasury Bond Index 1–5 Years. S&P and Dow Jones data © 2022 S&P Dow Jones Indices LLC, a division of S&P Global. All rights reserved. Frank Russell Company is the source and owner of the trademarks, service marks, and copyrights related to the Russell Indexes. MSCI data © MSCI 2022, all rights reserved. Bloomberg data provided by Bloomberg. Chart is for illustrative purposes only.